Subplots dan Layout
Matplotlib memungkinkan pembuatan multiple plots dalam satu figure.
Subplots Dasar
Menggunakan plt.subplots()
import matplotlib.pyplot as plt
import numpy as np

x = np.linspace(0, 10, 100)

# Membuat 2x2 subplots
fig, axes = plt.subplots(2, 2, figsize=(10, 8))

axes[0, 0].plot(x, np.sin(x))
axes[0, 0].set_title('sin(x)')

axes[0, 1].plot(x, np.cos(x))
axes[0, 1].set_title('cos(x)')

axes[1, 0].plot(x, np.tan(x))
axes[1, 0].set_ylim(-5, 5)
axes[1, 0].set_title('tan(x)')

axes[1, 1].plot(x, np.exp(-x/5) * np.sin(x))
axes[1, 1].set_title('Damped Oscillation')

plt.tight_layout()
plt.show()
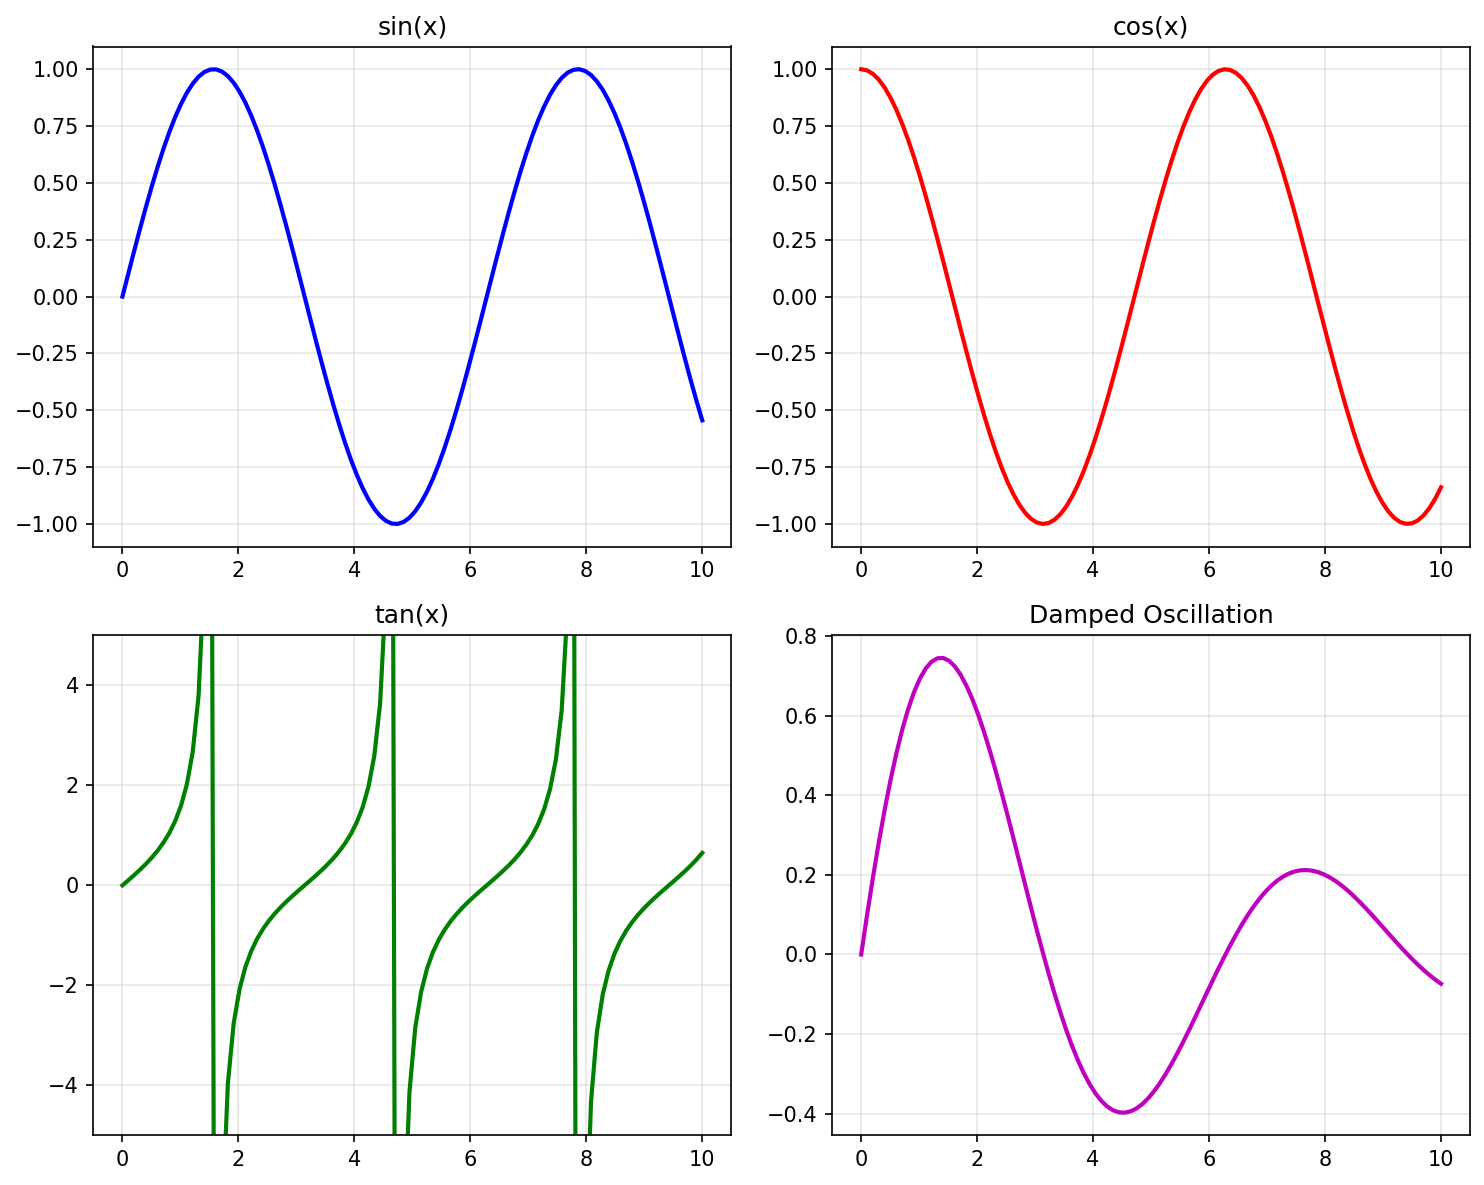
Subplots 2x2
Subplot 1D Array
import matplotlib.pyplot as plt
import numpy as np

x = np.linspace(0, 10, 100)

# 1 baris, 3 kolom
fig, axes = plt.subplots(1, 3, figsize=(15, 4))

axes[0].plot(x, x**2)
axes[0].set_title('Kuadrat')

axes[1].plot(x, np.sqrt(x))
axes[1].set_title('Akar Kuadrat')

axes[2].plot(x, np.log(x + 1))
axes[2].set_title('Logaritma')

plt.tight_layout()
plt.show()
GridSpec untuk Layout Kompleks
Layout Tidak Seragam
import matplotlib.pyplot as plt
import matplotlib.gridspec as gridspec
import numpy as np

x = np.linspace(0, 10, 100)

fig = plt.figure(figsize=(12, 8))
gs = gridspec.GridSpec(2, 3, figure=fig)

# Plot besar di kiri
ax1 = fig.add_subplot(gs[:, 0])  # Semua baris, kolom 0
ax1.plot(x, np.sin(x))
ax1.set_title('Plot Besar')

# 2 plot kecil di kanan atas
ax2 = fig.add_subplot(gs[0, 1])
ax2.plot(x, np.cos(x), 'r-')
ax2.set_title('Kanan Atas 1')

ax3 = fig.add_subplot(gs[0, 2])
ax3.plot(x, np.tan(x), 'g-')
ax3.set_ylim(-5, 5)
ax3.set_title('Kanan Atas 2')

# Plot lebar di kanan bawah
ax4 = fig.add_subplot(gs[1, 1:])  # Baris 1, kolom 1 sampai akhir
ax4.bar(['A', 'B', 'C', 'D'], [23, 45, 56, 78])
ax4.set_title('Plot Lebar')

plt.tight_layout()
plt.show()
Layout dengan Proporsi Berbeda
import matplotlib.pyplot as plt
import matplotlib.gridspec as gridspec
import numpy as np

fig = plt.figure(figsize=(12, 8))

# GridSpec dengan width dan height ratios
gs = gridspec.GridSpec(2, 2,
                       width_ratios=[2, 1],   # Kolom 1 lebih lebar
                       height_ratios=[1, 2],  # Baris 2 lebih tinggi
                       figure=fig)

ax1 = fig.add_subplot(gs[0, 0])
ax1.set_title('Wide Top Left')

ax2 = fig.add_subplot(gs[0, 1])
ax2.set_title('Narrow Top Right')

ax3 = fig.add_subplot(gs[1, 0])
ax3.set_title('Wide Tall Bottom Left')

ax4 = fig.add_subplot(gs[1, 1])
ax4.set_title('Narrow Tall Bottom Right')

plt.tight_layout()
plt.show()
Inset Axes
Plot di dalam plot:
import matplotlib.pyplot as plt
import numpy as np
from mpl_toolkits.axes_grid1.inset_locator import inset_axes

x = np.linspace(0, 10, 1000)
y = np.sin(x) * np.exp(-x/10)

fig, ax = plt.subplots(figsize=(10, 6))

# Plot utama
ax.plot(x, y)
ax.set_xlabel('x')
ax.set_ylabel('y')
ax.set_title('Plot dengan Inset')

# Inset axes
axins = inset_axes(ax, width="40%", height="40%", loc='upper right')
axins.plot(x, y)
axins.set_xlim(2, 4)
axins.set_ylim(0.3, 0.7)
axins.set_title('Zoom', fontsize=10)

plt.show()
Figure dengan Colorbar
import matplotlib.pyplot as plt
import numpy as np

# Data
x = np.linspace(-3, 3, 100)
y = np.linspace(-3, 3, 100)
X, Y = np.meshgrid(x, y)
Z = np.sin(X) * np.cos(Y)

fig, axes = plt.subplots(1, 2, figsize=(14, 5))

# Plot 1 dengan colorbar
im1 = axes[0].contourf(X, Y, Z, levels=20, cmap='viridis')
fig.colorbar(im1, ax=axes[0], label='Nilai')
axes[0].set_title('Contour Plot 1')

# Plot 2 dengan colorbar
im2 = axes[1].imshow(Z, cmap='coolwarm', extent=[-3, 3, -3, 3])
fig.colorbar(im2, ax=axes[1], label='Nilai')
axes[1].set_title('Imshow Plot')

plt.tight_layout()
plt.show()
Twin Axes
Dua skala Y yang berbeda:
import matplotlib.pyplot as plt
import numpy as np

x = np.linspace(0, 10, 100)
y1 = np.sin(x)
y2 = np.exp(x/3)

fig, ax1 = plt.subplots(figsize=(10, 5))

# Axis pertama (kiri)
color1 = 'tab:blue'
ax1.set_xlabel('x')
ax1.set_ylabel('sin(x)', color=color1)
ax1.plot(x, y1, color=color1)
ax1.tick_params(axis='y', labelcolor=color1)

# Axis kedua (kanan) - share x axis
ax2 = ax1.twinx()
color2 = 'tab:red'
ax2.set_ylabel('exp(x/3)', color=color2)
ax2.plot(x, y2, color=color2)
ax2.tick_params(axis='y', labelcolor=color2)

fig.suptitle('Plot dengan Dua Skala Y')
plt.tight_layout()
plt.show()
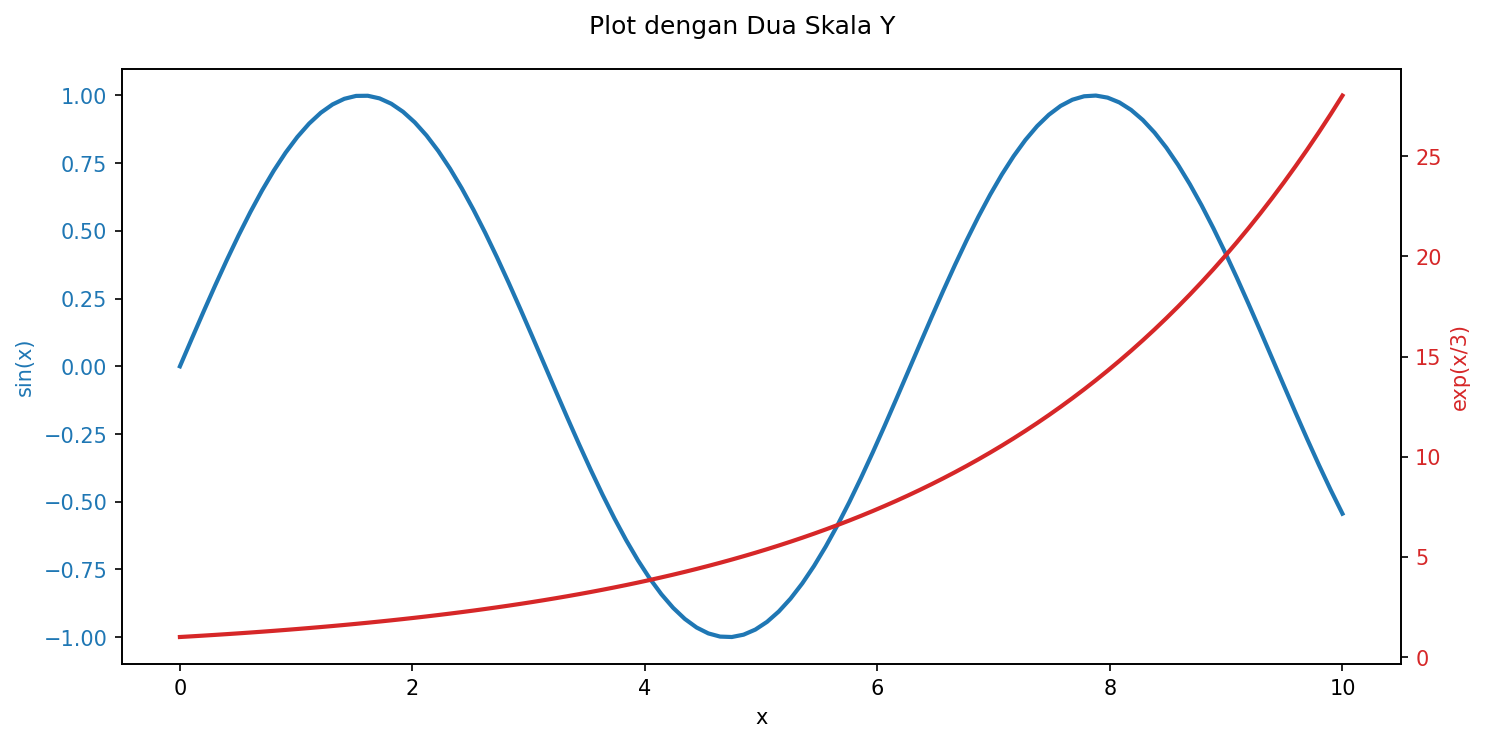
Plot dengan Dua Skala Y (Twin Axes)
Constrained Layout
Alternatif untuk tight_layout() yang lebih baik untuk layout kompleks:
import matplotlib.pyplot as plt
import numpy as np

x = np.linspace(0, 10, 100)

fig, axes = plt.subplots(2, 2, figsize=(10, 8), constrained_layout=True)

for i, ax in enumerate(axes.flat):
    ax.plot(x, np.sin(x + i))
    ax.set_title(f'Plot {i+1}')
    ax.set_xlabel('x')
    ax.set_ylabel('y')

fig.suptitle('Constrained Layout Example', fontsize=16)
plt.show()
Latihan
Buat figure dengan 4 subplot yang menampilkan jenis plot berbeda (line, scatter, bar, histogram)
Gunakan GridSpec untuk membuat layout dengan 1 plot besar di atas dan 3 plot kecil di bawah
Buat plot dengan twin axes untuk membandingkan suhu (Celsius) dan curah hujan
Tambahkan inset plot untuk menunjukkan detail pada area tertentu